In
Part I of this article I showed you how to write your own script(s) to track the screen resolution, browser
viewable size, and bit-depth, of your users. While you are gathering your own statistics, I'll offer mine up for review.
The site for which I gathered these statistics is
http://algonquinstudios.com/. It is the web site for my company, Algonquin Studios. It is not a portal site, or really any other kind of traditional destination on the web. It is a site that offers corporate information. Much of the site traffic comes from searches on Yahoo! and Snap for web development, enterprise application development, and various other software and web-related topics. A good deal of traffic comes from client sites, including a popular local not-for-profit. The rest of the traffic have no referrers and most likely are existing clients, leads, or people who just check on us every now and then (competitors, partners, friends, etc.).
I started with 1,000 records, and discarded 14 that had no data. There are some records that have questionable data, but only those with a bit-depth of '0'. So that left 986 good records on which I based these results. What I've done is break the data down per resolution tier. But first I will cover the aggregate data.
The window width and height represent the viewable space
within the window, not the actual window size. Instead of guessing who had what tool bars open, it seemed easier to just capture the actual usable real estate. Please keep that in mind as you view these numbers.
All Users
| Screen Width | Screen Height | Bit-Depth | Window
Inner Width | Window
Inner Height |
| Mean | 941 | 705 | 21 | 806 | 485 |
| Median | 1,024 | 768 | 16 | 783 | 446 |
| Mode | 1,024 | 768 | 16 | 780 | 602 |
|
| Highest | 2,560 | 1,024 | 32 | 1,372 | 1,014 |
| Lowest | 640 | 480 | 0 | 80 | 51 |
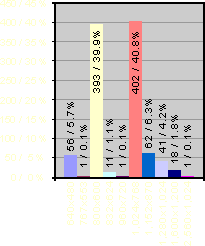
I've also created this handy chart to show you the actual numbers and percentage breakdowns of each resolution that visited the site. The x-axis represents the screen resolution, and the y-axis represents the number (of 986) and percent of users at that resolution.
640 x 480 (56 users, 5.7%)
| Window
Inner Width | Window
Inner Height | Bit-Depth |
| Mean | 600 | 304 | 17 |
| Median | 620 | 314 | 16 |
| Mode | 620 | 314 | 16 |
|
| Highest | 636 | 420 | 32 |
| Lowest | 416 | 156 | 1 |
800 x 600 (393 users, 39.9%)
| Window
Inner Width | Window
Inner Height | Bit-Depth |
| Mean | 719 | 397 | 20 |
| Median | 779 | 420 | 16 |
| Mode | 780 | 434 | 16 |
|
| Highest | 843 | 524 | 32 |
| Lowest | 80 | 96 | 8 |
832 x 624 (11 users, 1.1%)
| Window
Inner Width | Window
Inner Height | Bit-Depth |
| Mean | 756 | 442 | 21 |
| Median | 761 | 455 | 16 |
| Mode | 764 | 422 | 16 |
|
| Highest | 811 | 487 | 32 |
| Lowest | 669 | 365 | 8 |
1,024 x 768 (402 users, 40.8%)
| Window
Inner Width | Window
Inner Height | Bit-Depth |
| Mean | 881 | 539 | 22 |
| Median | 918 | 579 | 16 |
| Mode | 1,004 | 602 | 16 |
|
| Highest | 1,028 | 768 | 32 |
| Lowest | 80 | 51 | 8 |
1,152 x 870 (62 users, 6.3%)
| Window
Inner Width | Window
Inner Height | Bit-Depth |
| Mean | 925 | 630 | 25 |
| Median | 889 | 667 | 32 |
| Mode | 836 | 696 | 32 |
|
| Highest | 1,148 | 731 | 32 |
| Lowest | 659 | 364 | 0 |
1,280 x 1,024 (41 users, 4.2%)
| Window
Inner Width | Window
Inner Height | Bit-Depth |
| Mean | 963 | 710 | 22 |
| Median | 932 | 755 | 24 |
| Mode | 1,260 | 597 | 32 |
|
| Highest | 1,276 | 886 | 32 |
| Lowest | 708 | 347 | 0 |
1,600 x 1,200 (18 users, 1.8%)
| Window
Inner Width | Window
Inner Height | Bit-Depth |
| Mean | 960 | 755 | 25 |
| Median | 883 | 758 | 28 |
| Mode | 883 | 771 | 32 |
|
| Highest | 1,372 | 1,014 | 32 |
| Lowest | 751 | 480 | 16 |
Other Users
There are also a few records that had unique settings. They are as follows:
- One user with monitor resolution of 767 x 553 x 32-bit. Viewable browser area was 763 x 442.
- One user with monitor resolution of 960 x 720 x 16-bit. Viewable browser area was 940 x 578.
- One user with monitor resolution of 2,560 x 1,024 x 16-bit. Viewable browser area was 628 x 623.
Finally
Some of you who are better number crunchers than I may be interested in looking at the log. Some of you may want to verify what I've found. You can get your own
copy of the log, with IP addresses removed.
You will note some odd numbers above every now and then. Some browsers reported '0' as the bit depth. This is most likely incorrect, but I have left the data in there instead of dumping the whole record. A bit-depth of '1', however, is quite possible. You will also note that while bit-depths can come as 1, 4, 8, 16, 24, and 32, some charts show a mean bit-depth of 17, or some other number. This is an average. I leave it up to the user to determine whether or not he/she would round it up or down. In these cases, the median or mode would be more useful.
Some related articles
A founder of evolt.org, Adrian Roselli (aardvark) is the Senior Usability Engineer at Algonquin Studios, located in Buffalo, New York.
Adrian has years of experience in graphic design, web design and multimedia design, as well as extensive experience in internet commerce and interface design and usability. He has been developing for the World Wide Web since its inception, and working the design field since 1993. Adrian is a founding member, board member, and writer to evolt.org. In addition, Adrian sits on the Digital Media Advisory Committee for a local SUNY college and a local private college, as well as the board for a local charter school.
You can see his brand-spanking-new blog at http://blog.adrianroselli.com/ as well as his new web site to promote his writing and speaking at AdrianRoselli.com
Adrian authored the usability case study for evolt.org in Usability: The Site Speaks for Itself, published by glasshaus. He has written three chapters for the book Professional Web Graphics for Non Designers, also published by glasshaus. Adrian also managed to get a couple chapters written (and published) for The Web Professional's Handbook before glasshaus went under. They were really quite good. You should have bought more of the books.